


A modern JavaScript charting library to build interactive charts and visualizations with simple API.

Our Partner

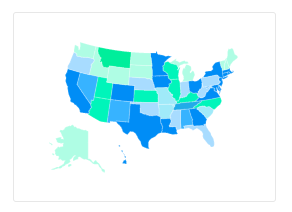
ApexCharts is now a partner of FusionCharts to bring a wider range of data visualization components.
They offer data driven maps, gauges, widgets, advanced timeseries charts and much more.
## Browsers support
| [ ](http://godban.github.io/browsers-support-badges/)
Firefox | [ ](http://godban.github.io/browsers-support-badges/)
Chrome | [ ](http://godban.github.io/browsers-support-badges/)
Safari | [ ](http://godban.github.io/browsers-support-badges/)
Edge | [ ](http://godban.github.io/browsers-support-badges/)
IE11 |
| ----------------------------------------------------------------------------------------------------------------------------------------------------------------------------------------------------------------- | ------------------------------------------------------------------------------------------------------------------------------------------------------------------------------------------------------------- | ------------------------------------------------------------------------------------------------------------------------------------------------------------------------------------------------------------- | ------------------------------------------------------------------------------------------------------------------------------------------------------------------------------------------------------ | ------------------------------------------------------------------------------------------------------------------------------------------------------------------------------------------------ |
| 31+ ✔ | 35+ ✔ | 6+ ✔ | Edge ✔ | [(IE11)](#using-it-with-ie11) ✔ |
## Download and Installation
##### Installing via npm
```bash
npm install apexcharts --save
```
##### Direct <script> include
```html
```
## Wrappers for Vue/React/Angular/Stencil
Integrate easily with 3rd party frameworks
- [vue-apexcharts](https://github.com/apexcharts/vue-apexcharts)
- [react-apexcharts](https://github.com/apexcharts/react-apexcharts)
- [ng-apexcharts](https://github.com/apexcharts/ng-apexcharts) - Plugin by [Morris Janatzek](https://morrisj.net/)
- [stencil-apexcharts](https://github.com/apexcharts/stencil-apexcharts)
### Unofficial Wrappers
Useful links to wrappers other than the popular frameworks mentioned above
- [apexcharter](https://github.com/dreamRs/apexcharter) - Htmlwidget for ApexCharts
- [apexcharts.rb](https://github.com/styd/apexcharts.rb) - Ruby wrapper for ApexCharts
- [larapex-charts](https://github.com/ArielMejiaDev/larapex-charts) - Laravel wrapper for ApexCharts
- [blazor-apexcharts](https://github.com/joadan/Blazor-ApexCharts) - Blazor wrapper for ApexCharts [demo](https://joadan.github.io/Blazor-ApexCharts/)
- [svelte-apexcharts](https://github.com/galkatz373/svelte-apexcharts) - Svelte wrapper for ApexCharts
## Usage
```js
import ApexCharts from 'apexcharts'
```
To create a basic bar chart with minimal configuration, write as follows:
```js
var options = {
chart: {
type: 'bar'
},
series: [
{
name: 'sales',
data: [30, 40, 35, 50, 49, 60, 70, 91, 125]
}
],
xaxis: {
categories: [1991, 1992, 1993, 1994, 1995, 1996, 1997, 1998, 1999]
}
}
var chart = new ApexCharts(document.querySelector('#chart'), options)
chart.render()
```
This will render the following chart

### A little more than the basic
You can create a combination of different charts, sync them and give your desired look with unlimited possibilities.
Below is an example of synchronized charts with github style.
## Interactivity
Zoom, Pan, Scroll through data. Make selections and load other charts using those selections.
An example showing some interactivity
## Dynamic Series Update
Another approach to Drill down charts where one selection updates the data of other charts.
An example of loading dynamic series into charts is shown below
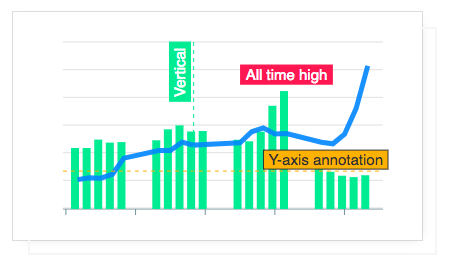
## Annotations
Annotations allows you to write custom text on specific values or on axes values. Valuable to expand the visual appeal of your chart and make it more informative.
## Mixed Charts
You can combine more than one chart type to create a combo/mixed chart. Possible combinations can be line/area/column together in a single chart. Each chart-type can have it's own y-axis.

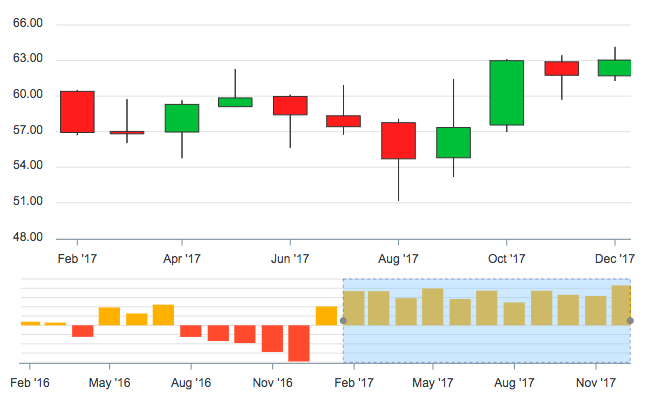
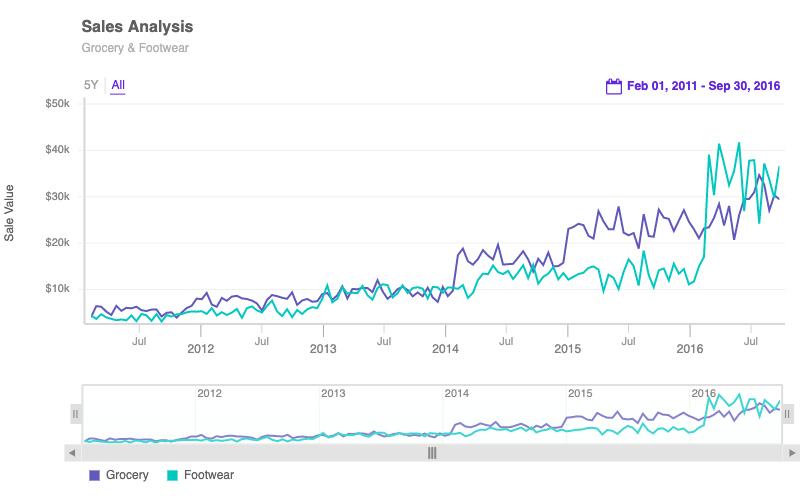
## Candlestick
Use a candlestick chart (a common financial chart) to describe price changes of a security, derivative, or currency. Below image show how you can use another chart as a brush/preview-pane which acts as a handle to browse the main candlestick chart.
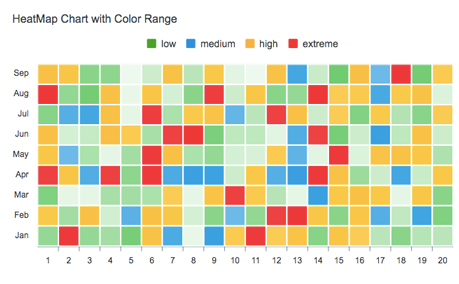
## Heatmaps
Use Heatmaps to represent data through colors and shades. Frequently used with bigger data collections, they are valuable for recognizing patterns and area of focus.
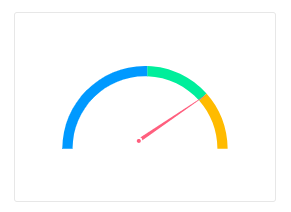
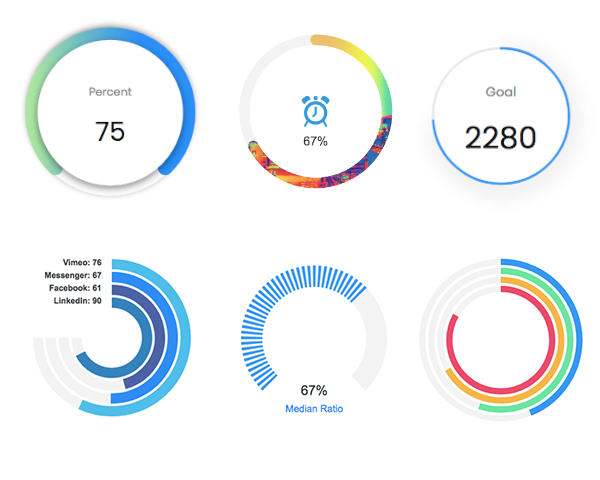
## Gauges
The tiny gauges are an important part of a dashboard and are useful in displaying single series data. A demo of these gauges:
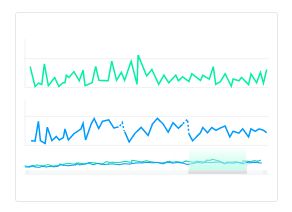
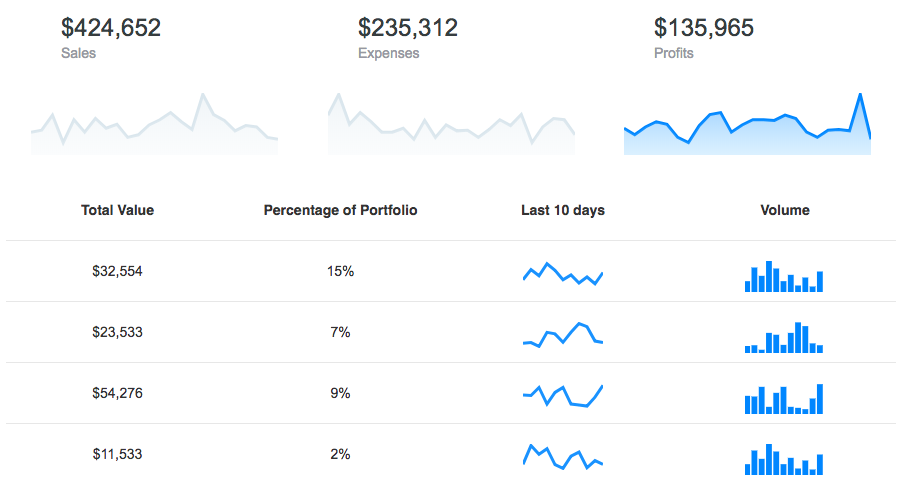
## Sparklines
Utilize sparklines to indicate trends in data, for example, occasional increments or declines, monetary cycles, or to feature most extreme and least values:
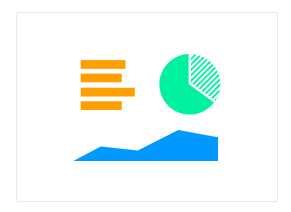
## More advanced chart types from our friends at FusionCharts  Thanks to our friends at FusionCharts, you now have a better data experience of your time-series data with features like visual time navigator, annotations with the date and event markers, multi-variate analysis, and real-time support.
## Export full dashboards
Want to export your dashboards to PDF, send them via email or simply export a chart on the server-side? You can do these and more with FusionExport, a new product from our friends at FusionCharts.

## What's included
The download bundle includes the following files and directories providing a minified single file in the dist folder. Every asset including icon/css is bundled in the js itself to avoid loading multiple files.
```
apexcharts/
├── dist/
│ └── apexcharts.min.js
├── src/
│ ├── assets/
│ ├── charts/
│ ├── modules/
│ ├── utils/
│ └── apexcharts.js
└── samples/
```
## Using it with IE11
If you need to make it work with IE11, you need to include these polyfills before including ApexCharts
- [promise-polyfill](https://cdn.jsdelivr.net/npm/promise-polyfill@8/dist/polyfill.min.js)
- [classlist.js](https://cdn.jsdelivr.net/npm/eligrey-classlist-js-polyfill)
- [findIndex](https://cdn.jsdelivr.net/npm/findindex_polyfill_mdn) - You will need this only if you require timeline/rangebar charts
- [canvg](https://unpkg.com/canvg@3.0.4/lib/umd.js) - You will need this only if you require PNG download of your charts
## Development
#### Install dependencies and run project
```bash
npm install
npm run dev
```
This will start the webpack watch and any changes you make to `src` folder will auto-compile and output will be produced in the `dist` folder.
#### Minifying the src
```bash
npm run build
```
## Where do I go next?
Head over to the documentation section to read more about how to use different kinds of charts and explore all options.
## Contacts
Email: info@apexcharts.com
Twitter: @apexcharts
Facebook: fb.com/apexcharts
## Dependency
ApexCharts uses SVG.js for drawing shapes, animations, applying svg filters and a lot more under the hood. The library is bundled in the final build file, so you don't need to include it.
## Supporting ApexCharts
ApexCharts is an open source project. Financial contributions to ApexCharts go towards ongoing development costs, servers, etc. You can help by becoming a supporter on Patreon or doing a one time donation on PayPal
## Our Partners
While ApexCharts brings you the goodness of open-source charts, FusionCharts offers additional visualizations for your dashboards. With extensive documentation, consistent API, and cross-browser support, FusionCharts is loved by 28,000+ customers and 750,000+ developers across the globe.
## License
ApexCharts is released under MIT license. You are free to use, modify and distribute this software, as long as the copyright header is left intact.